The cPanel Dashboard allows you to view call data, times, agent info, typings, leads and in general everything necessary for conducting and analyzing the campaign, both in real time and in historical data.
Information is presented in both plain text and graphics. Most graphs can also be viewed in table format.
Icons
| Icon | Menu | Description |
|---|---|---|
| Real Time | Real time information | |
| General Graphics | Allows you to see general graphics of the campaign | |
| Agents Graphics | Allows you to view agent information | |
| Typing Graphics | Allows you to view typing information | |
| Leads Graphics | Allows you to view lead information | |
| Change DDIs | Allows you to change the campaign ddis |
Each of these menus is described in detail below.
Real Time menu
Allows you to view real-time data from the campaign.
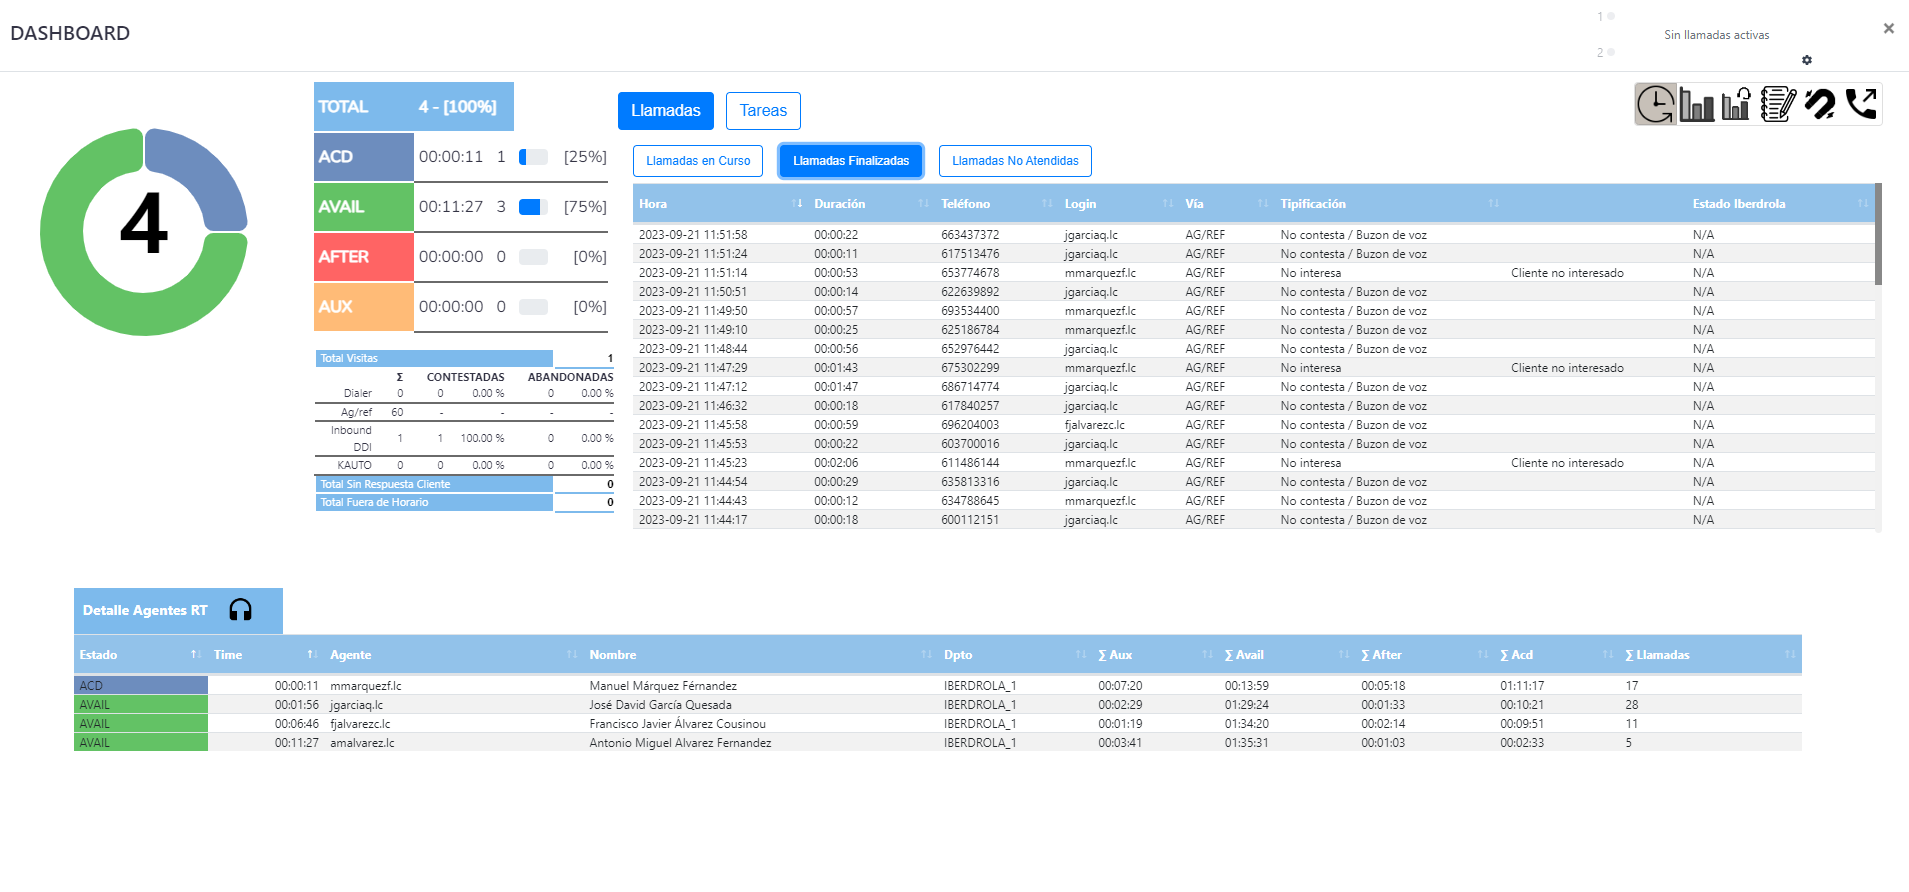
The information offered includes:
General info
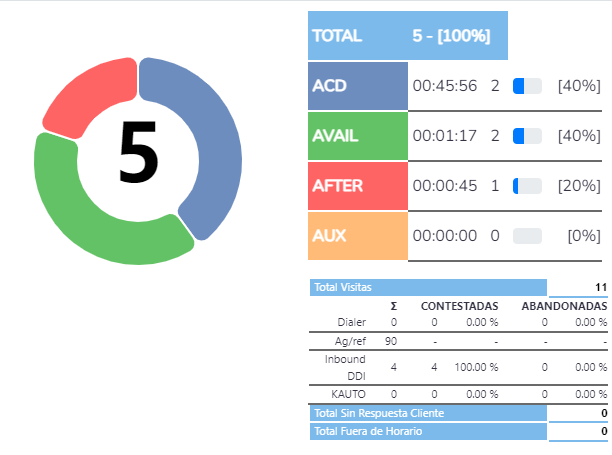
Shows information about the total number of agents currently connected, broken down by status. In addition, it shows the longest time associated with each state, to facilitate the conduct of the campaign.
By clicking on each of the status boxes (ACD, AVAIL, AFTER and AUX) or on their corresponding analogues of the pie chart, those agents that are currently in that state are hidden/displayed.
At the bottom it shows real-time information on the breakdown of visits, calls answered and abandonments of the day.
| Field | Description |
|---|---|
| Total visits | Total number of visits to the landing (visits to the website) today, whether or not they have completed the contact request form. |
| Total answered | For each of the origins, percentage and number of calls answered today. |
| Total abandoned | For each of the origins, percentage and number of calls abandoned today. |
| Total No Response Client | Total number of calls that have not been answered by the customer. |
| Total Out of Time | Total number of call requests made outside of campaign hours today. |
Active calls

Shows information about active calls. The fields shown are:
| Field | Description |
|---|---|
| Calldate | Time at which the call was established. |
| Duration | Accumulated call time. |
| Phone number | Call phone number. |
| Login | Login that is answering the call (UserID). |
| Origin | Call origin (Can be AG/REF, INBOUND or DIALER) |
Time zone
The times shown are Madrid/Spain (GMT+1)
The data is presented ordered by Calldate, from lowest to highest. Click successively on the table fields to sort by ascending or descending.
Ended calls

Shows information about the calls that have already been answered and completed today. The fields shown are:
| Field | Description |
|---|---|
| Time | Time the call was established. |
| Duration | Accumulated time that the call has lasted. |
| Phone number | Phone number. |
| Login | Login that is answering the call (UserID). |
| Origin | Call origin. |
| Typing data | Data associated with the agent's typing. |
Red color
If the call was not typified by the agent, it is displayed in red.
Time zone
The times shown are Madrid/Spain (GMT+1)
The data is presented ordered by Calldate, from lowest to highest. Click successively on the table fields to sort by ascending or descending.
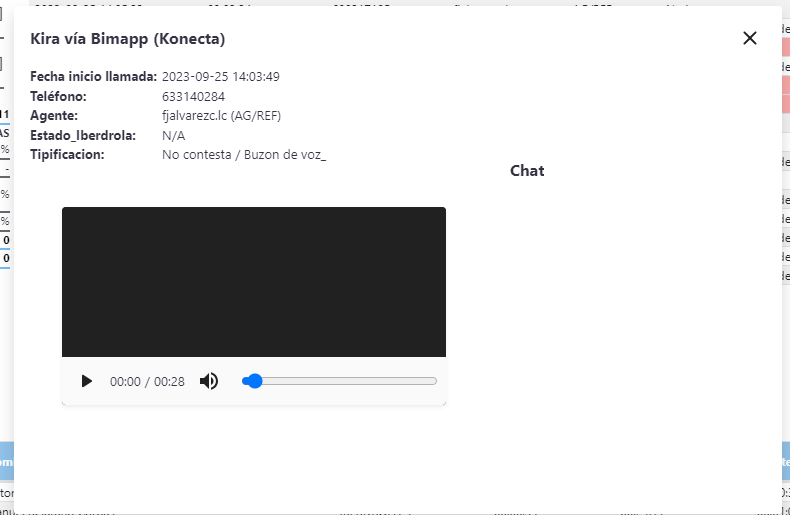
If we select the cursor over a call, it will show us the following icon
If we click, an informative modal appears with the information of the call, the audio of the call and the video and the chat if it occurs.
Abn calls
Abandonment occurs when a call enters the agent queue, but there are no agents in available status (AVAIL)

Shows information about the abandoned calls today. The fields shown are:
| Field | Description |
|---|---|
| Time | Time the call was established. |
| Phone | Accumulated time that the call has lasted. |
| Origin | Call origin. |
Red phone number
If the number is red, it means that number has been called subsequently after abandonment.
Agent's detail
Audit queue
With this icon , you can audit the agents queue.
Shows the list of agents currently connected and their most relevant associated data:

| Field | Description |
|---|---|
| State | Current agent status. |
| Time | Current state time. |
| UserID | Agent's ID. |
| Name-Surname | Agent's full name. |
| Department | Agent's department. |
| ∑ Aux | AUX time today. |
| ∑ Avail | AVAIL time today. |
| ∑ After | AFTER time today. |
| ∑ Acd | ACD time today. |
| ∑ Llamadas | Total calls answered today. |
The telephony states are:
| States and substates |
|---|
| AVAIL |
| AFTER |
| ACD |
| AUX - Defecto |
| AUX - Formación |
| AUX - Trabajo Administrativo |
| AUX - Descanso Laboral |
| AUX - Reunión |
| AUX - Pausa Visual |
| AUX - Asistencia Médica |
| AUX - Baño |
| AUX - Llamada Saliente |
Warning about Aux substates
In any information where AUX appears, all associated substates are counted.
If you click on the user ID, a modal will be shown with the following information
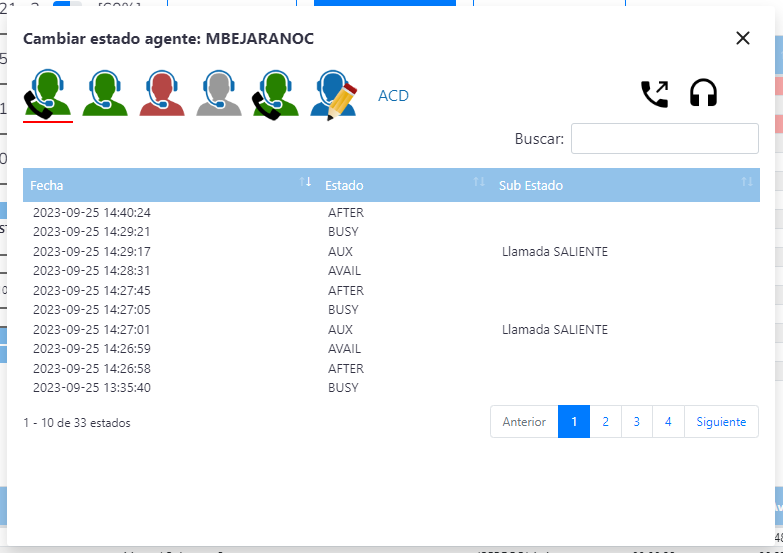
You can see the history of agent status changes, audit an agent, call an agent or change the status agent.
General graphs menu
It allows you to view data from a range of dates, presenting the information graphically.
Show and Hide Information
Each section of this menu can be hidden by clicking on its title. A displayed element displays the ▼ icon in its title descriptor, while a hidden item displays the ▲ icon
Most charts have alternative display options
| Icon | Description |
|---|---|
| View data in table format. | |
| View pie chart. | |
| View line chart. | |
| View bar chart. | |
| See chart in percent. | |
| See chart in values. |
Tooltip
If we go over any graph, there is a tooltip that summarizes the information.
Filters and date selectors
Allows you to select the date range for which you want to obtain information. It consists of a date selector indicating the start and end. It also has quick filters: today, this week or this month.
By default the information displayed is that of the current day.
General Information
This section shows general information.

Muestra la siguiente información:
| Graph | Description |
|---|---|
| % Typing | Indicates the percentage of typed calls. |
| Times in each state | Indicates the times of each of the telephony states ( Aux, Avail, After y Acd ) |
| Times in each state by time zone | Indicates the times by time zone of each of the telephony states ( Aux, Avail, After y Acd ) |
The graphic Times in each state by time zone allows you to hide/show the different times drawn on it by clicking on its legend
Requests, Calls and Abandoned
This section shows information about interactions.
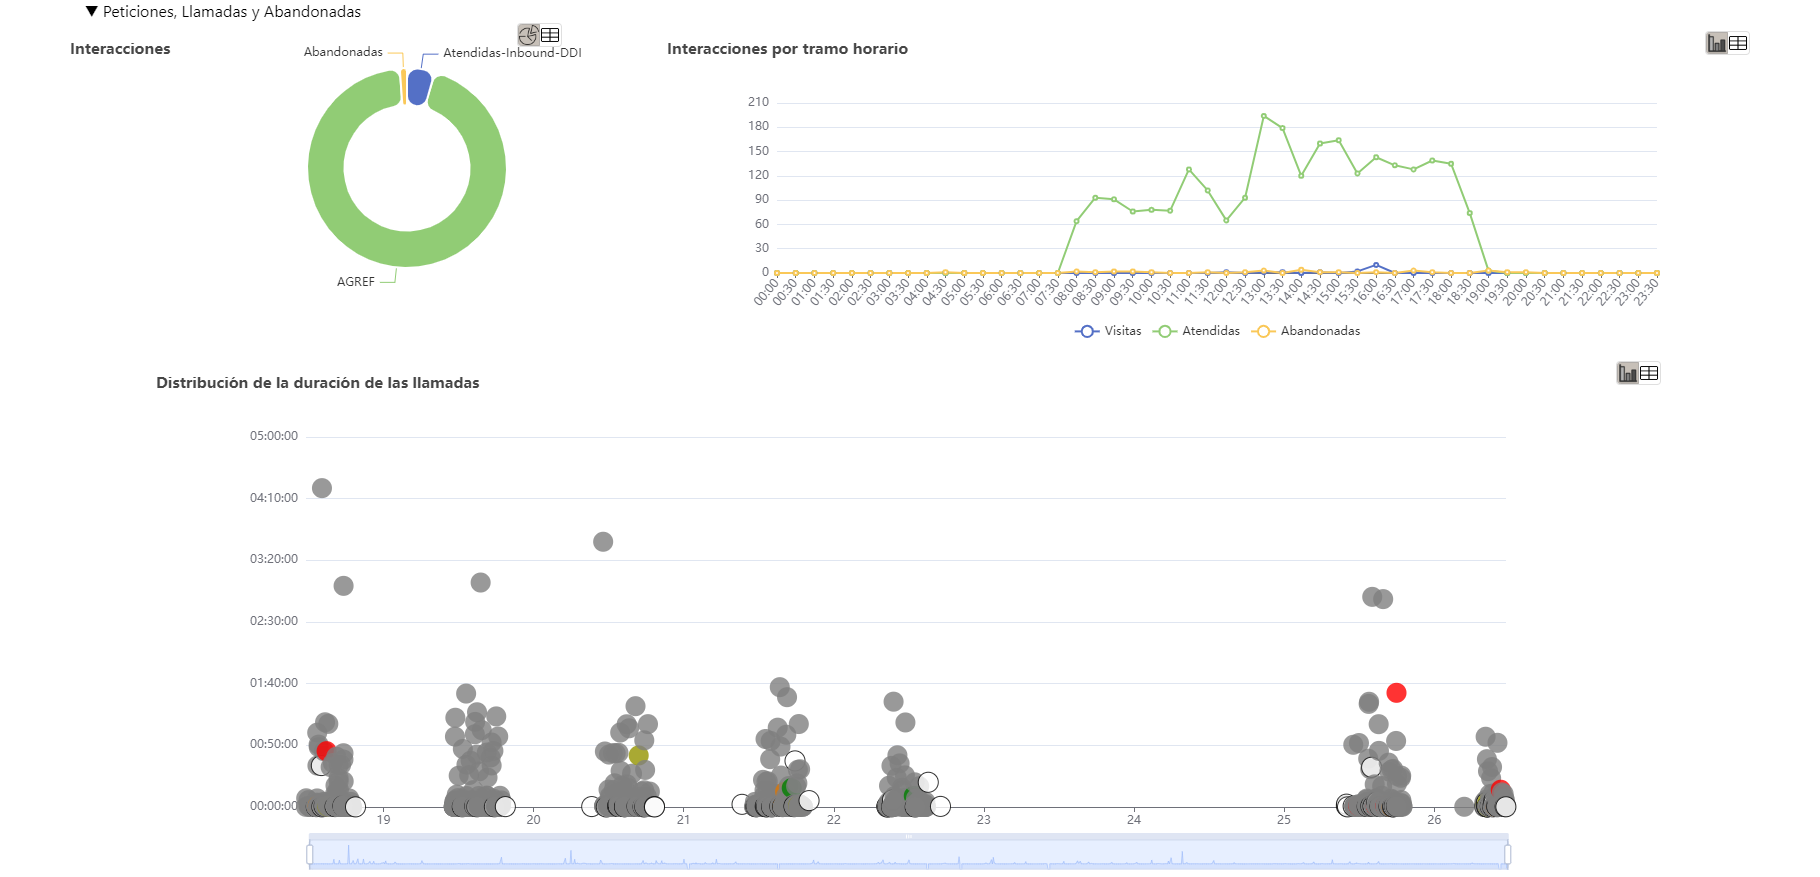
| Graph | Description |
|---|---|
| Interactions | Indicates the percentage of typed calls. |
| Interactions by time zone | Indicates the times of each of the telephony states ( Aux, Avail, After y Acd ) |
| Calls duration distribution | Indicates the duration of the call with respect to the date of the call. The Y axis is the duration in HH:mm:ss format. The X axis is the date of the call |
Default information
By default, the information is displayed only in graphs, with the associated table(s) being hidden.
Calls duration distribution graph
It has zoom to view the calls. The color of the bubbles is related to the agent's typing
Agent information
This section shows information about agent calls.

| Graph | Description |
|---|---|
| Calls | Indicates the number of calls per agent. |
| Calls by time zone | Indicates the number of calls per agent per time slot |
Agent display Calls by time zone graph
If you click on the agent's legend, it will hide it in the graph.
Visit Details: Browser, OS and Device
This section shows information about what browsers, operating system and devices the client has used to access the website.

| Graph | Description |
|---|---|
| Visits from each browser | Information about the browser used to access the landing website. |
| Visits from each operating system | Information about the Operating System (OS) used to access the landing website with details of the versions. |
| Visits from each operating device | Information about the type of physical device (Device) used to access the landing website. |
Agents graphs
It allows you to view agent information graphically related to calls, classifications, statuses and lead searches.
Tooltip
If we go over any graph, there is a tooltip that summarizes the information.
Filters and date selectors
Allows you to select the date range for which you want to obtain information. It consists of a date selector indicating the start and end. It also has quick filters: today, this week or this month.
By default the information displayed is that of the current day.
Graphs
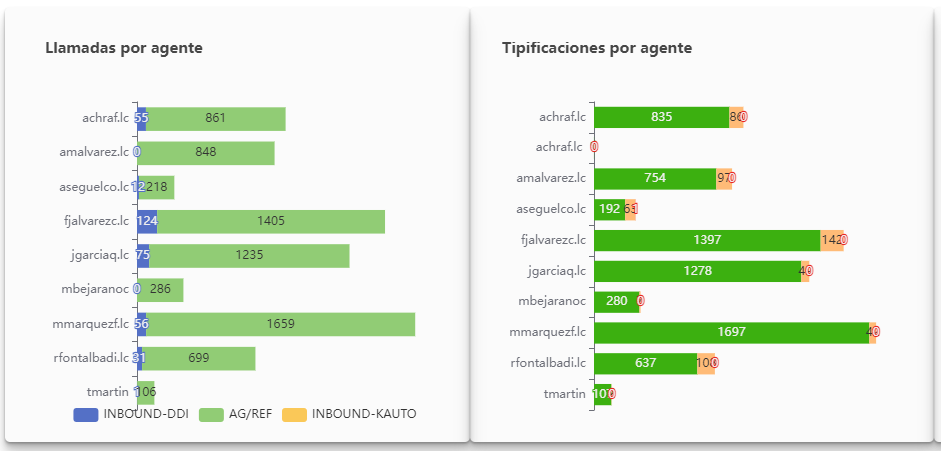
The first graph indicates all the calls answered by the agents, with their corresponding call origin. Here we can see who has answered the most INBOUND calls or who has made the most AG/REF calls.
Legend
If we place it in the chart legend, we hide the selected item in the chart.
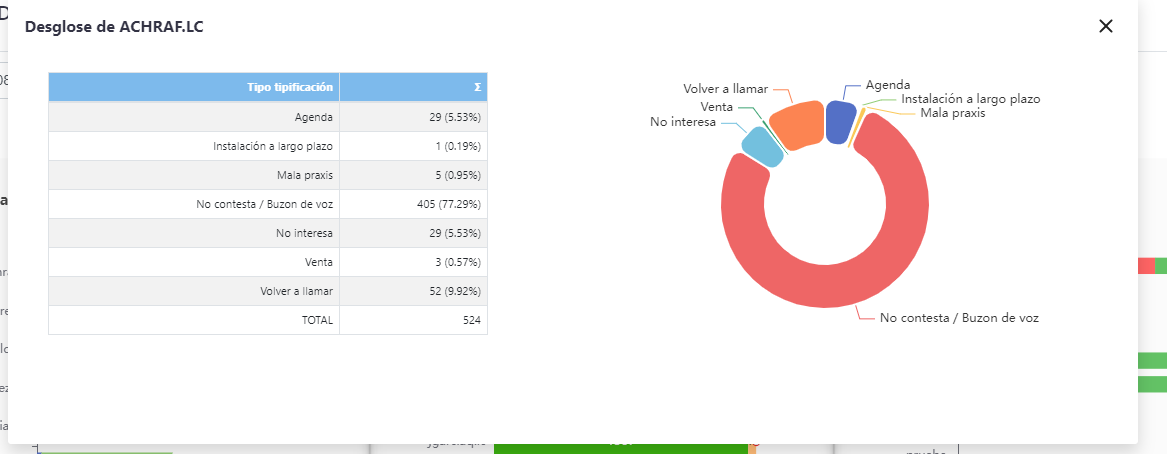
The second graph indicates the typings made by the agents. We have three colors to represent: in green the calls that were not typied, in orange the calls that were typied at a time after the call, and in red those calls that were not typied.
If we click on the typed calls bar (green bar), a modal opens with detailed information on the types. Here we can see the breakdown based on the type of typing that the agent made, both in table format and in graphic format. The table indicates both percentage and absolute value.
Let's see more graphs related to agents.
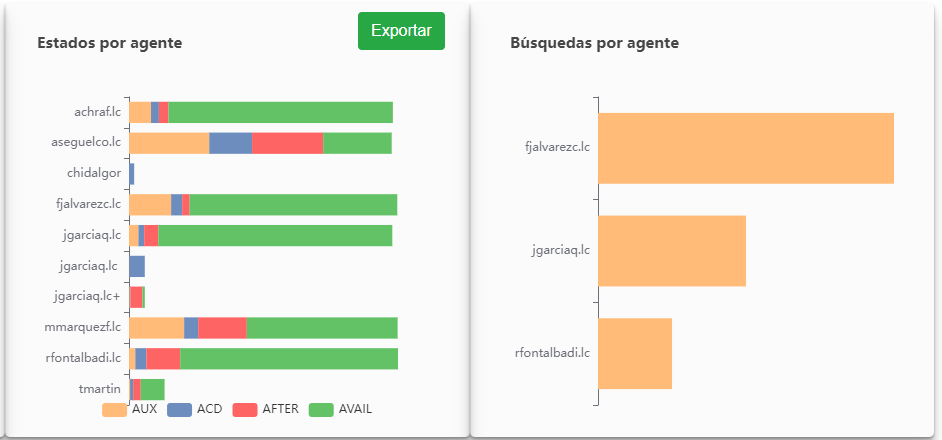
The first graph indicates the information related to the times in which the agent has been in the tool.
Export to csv
By clicking on the export button, we can export the information associated with the times in each of the states, also including the breakdown of AUX states.
If you click on the graph, in the orange bar (AUX state), a modal appears with the information of the AUX substates, indicating both percentage and absolute value, and a graph of this.
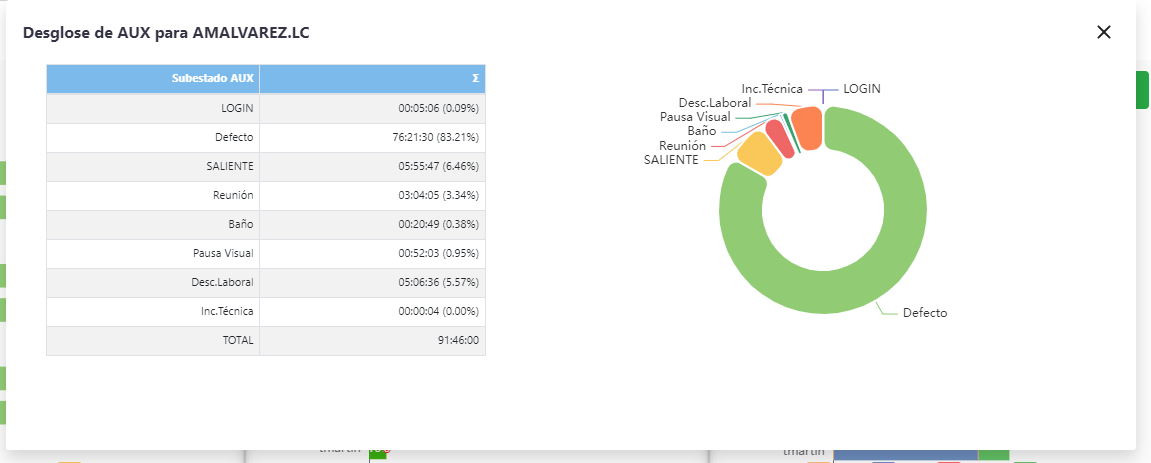
The second graph indicates the searches that the agents have carried out to consult the information associated with a telephone number
Typing data
This menu allows you to view the coding data made by the agents on the calls answered.
Filters and date selectors
Allows you to select the date range for which you want to obtain information. It consists of a date selector indicating the start and end. It also has quick filters: today, this week or this month.
By default the information displayed is that of the current day.
Export to csv
By clicking on the export button, we can export the information associated with the typings.
Results

The calls shown are all answered calls (whether encrypted or not).
The information displayed is:
| Field | Description |
|---|---|
| Datetime | Call date and time. |
| Phone | Client's phone number. |
| Typing | Agent typing. |
| Sub-Typing | Agent subtyping. |
| Observation | Observations entered by the agent. |
| Agent | Call agent. |
| Scheduled date | If the call was scheduled, scheduled date of the call. |
| Scheduled agent | If the call was scheduled, agent scheduled. |
| SMS | Indicates if an SMS was sent during the call. |
| SMS text | Indicates the text that was sent in case the SMS was sent |
Warning
All fields displayed are highly dependent on the campaign and can be customized to suit.
Time zone
The times shown are Madrid/Spain (GMT+1)
Leads funnel
This menu allows you to view the leads provided.
Filters and date selectors
Allows you to select the date range for which you want to obtain information. It consists of a date selector indicating the start and end. It also has quick filters: today, this week or this month.
By default the information displayed is that of the current day.
Export to csv
By clicking on the export button, we can export the information associated with the leads.
Funnel leads
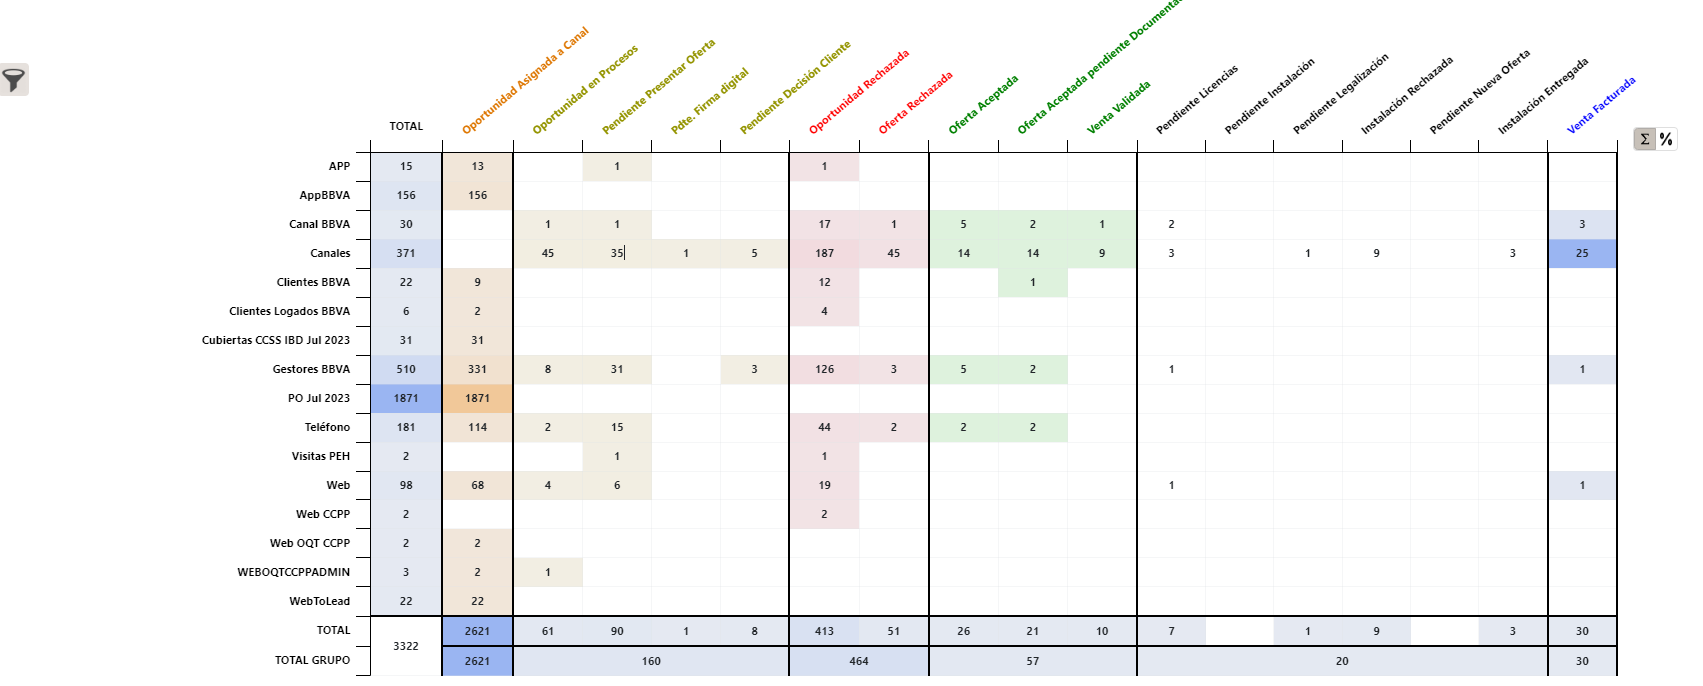
As you can see in the image, with this funnel we want to represent all the information associated with the leads. The X axis represents the list of states in which a lead can be and the Y axis represents the different channels of origin of the leads.
Colors
Depending on the status, the column is represented in a particular color
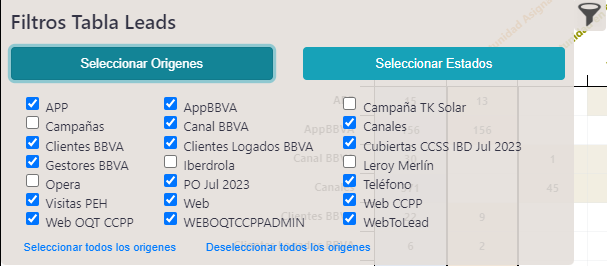
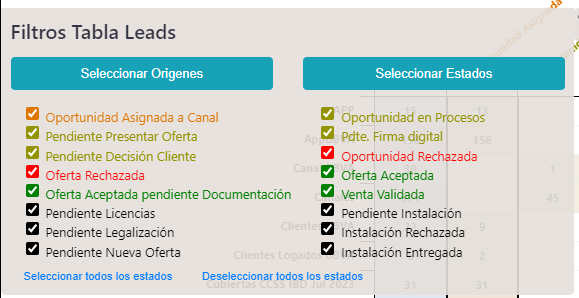
With the icon located in the upper left, a series of dynamic filters are displayed.
We can filter based on the origin of the lead, or based on the status of the lead.
Dynamic filters
These filters are dynamic, when you select/deselect a filter item, the action is automatically performed in the funnel.
Select / Unselect all
We can select or deselect all filters.
Value/Percentage
With the icons located at the top right, we can toggle the view to value or percentage.
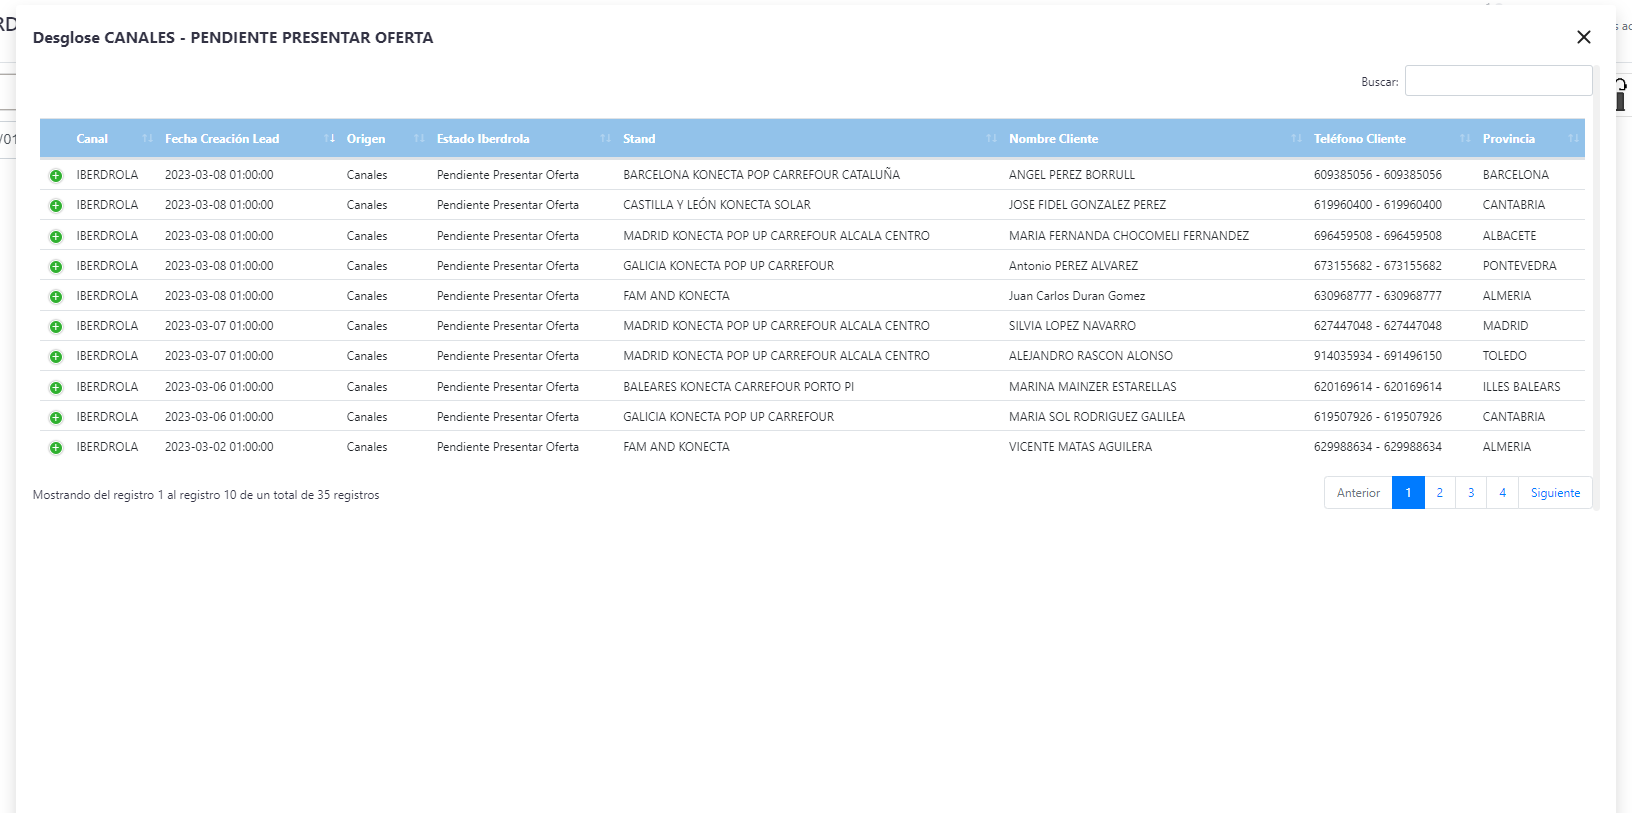
If we click on each of the cells in the table, a mode is displayed with detailed information about the leads.
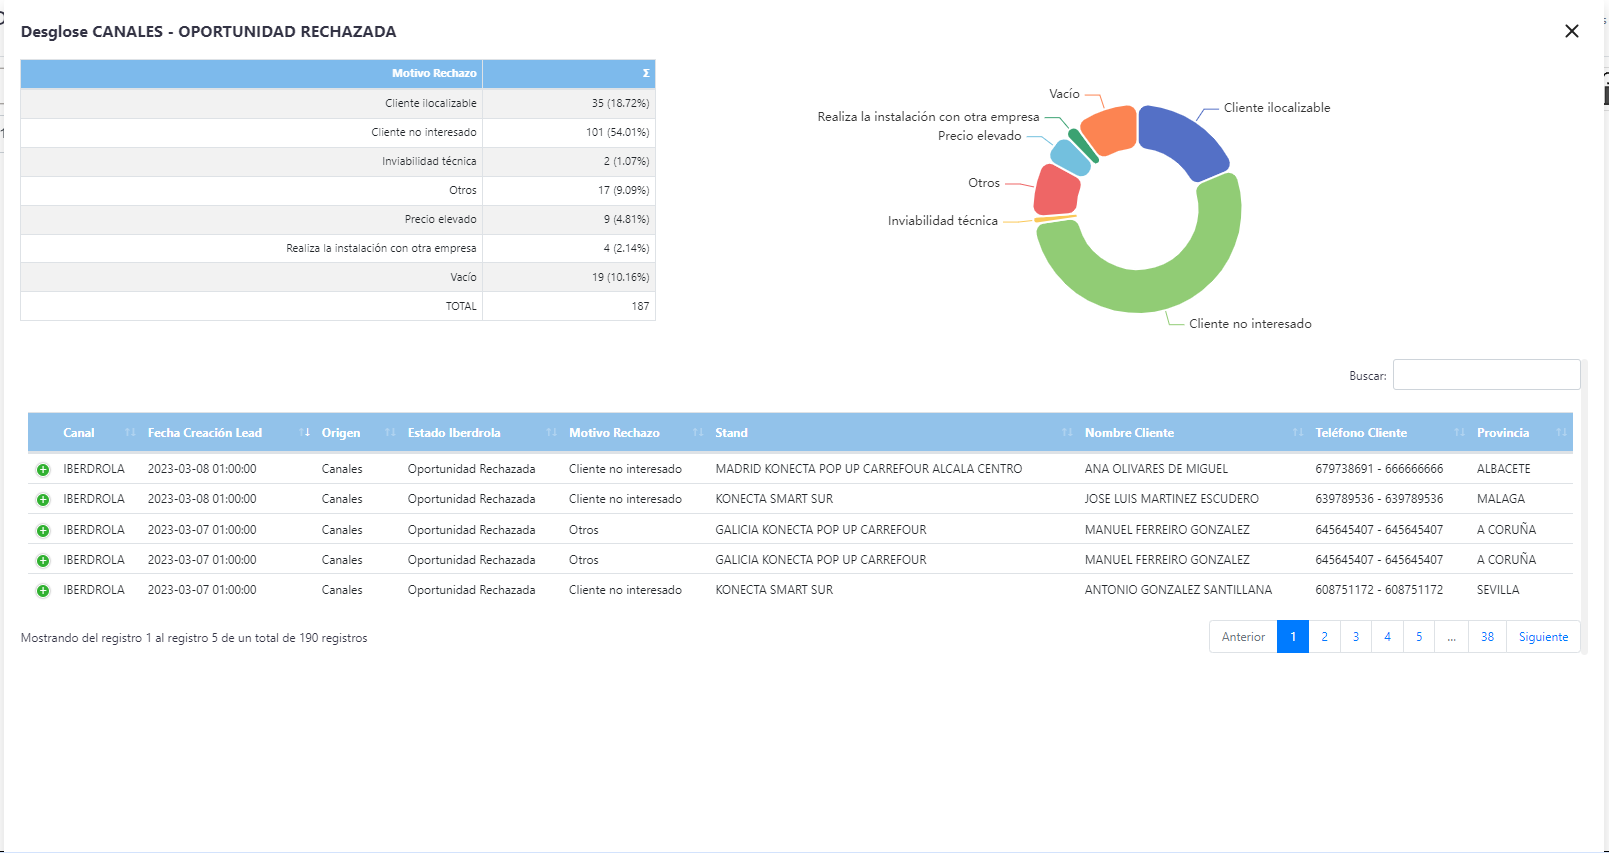
Opportunity rejected or offer rejected status
If we click on a cell with these statuses, in addition to the lead information, information related to the reason for rejection is displayed, both in graph and table (value and percentage).
Map leads
Here we can see a table and a map that aims to show which provinces have the most leads. A heat map is followed, the darker the color, the more leads there are from that province.
TIP
The values will be presented both in percentage and in value, and can be sorted.
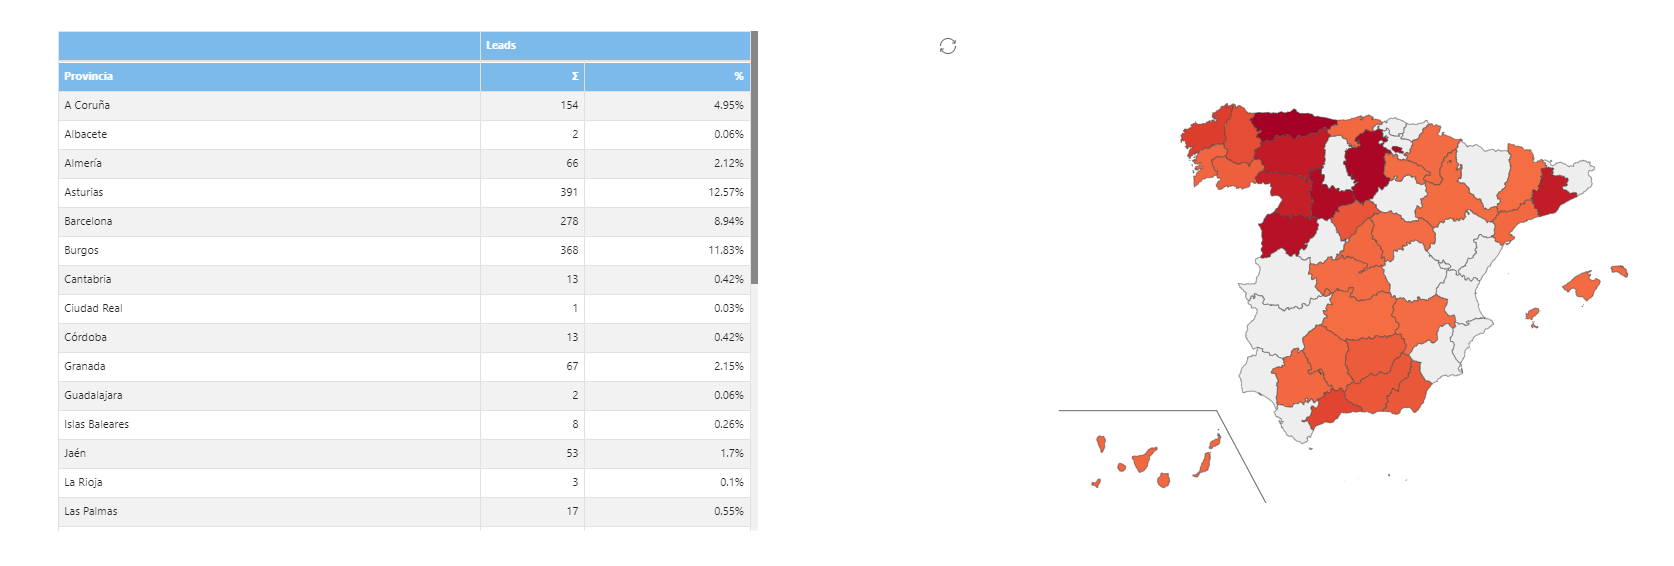
Mouse over map
If we move over the map, only the province we are in is selected in the table, displaying a tooltip with information.

Change DDI
This module allows you to change the DDIs with which agents make outgoing calls (AG/REF).
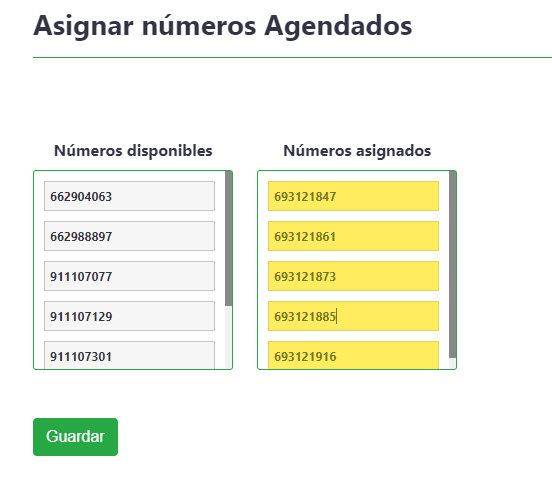
In the left box are the numbers available to use, in the right the numbers that are being used right now.
It is a drag and drop system, if you want to enable/disable the numbers, just drag them to the corresponding box and click the save button.